

We launched the Development Finance Observatory last week, and the questions poured in. Here’s what you asked most, and what you need to know.
What is the DFO?
It's a data analyst in your pocket. It brings more than 100,000 development finance indicators into a single platform, with an AI trained by ONE's policy experts, so you can just ask a question and get a trustworthy, verifiable answer. If you already know what you're looking for, you can search directly for a dataset, or connect the DFO to your favorite tools.
Why not just use the OECD or World Bank sites?
Because most real questions cut across several sources of official data. The DFO pulls together data from the OECD, World Bank, IMF, the UN and others and reconciles across their quirks. Comparing Kenya’s debt with its health aid used to mean two datasets and an afternoon in Excel. Now it’s one question, with the original source linked from every number.
Can I use it in Claude or Gemini?
Yes, in about two minutes. Your assistant answers from the clean, verified data in the DFO and names the source of every number. Learn how here.
What's coming next, and how do I keep up?
Our public roadmap on the DFO site lists what's live now and what we're building. Up next we’re adding data covering south-south aid providers, global public goods, and health spending by country. Upvote the datasets you want on the public roadmap. Something missing? Use the feedback button on the site, or reply to this email.
What can I do with it? Three examples:
Weigh debt payments against aid. Debt is central to development finance, and it's important to see in context with other financial flows. But different sources (like debt and aid) come from different institutions, in different formats. The DFO puts a country's debt service next to the aid it receives, in the same units and years, so you can see both pictures in a single view. We also include data on remittances, foreign direct investment, and other finacial flows.
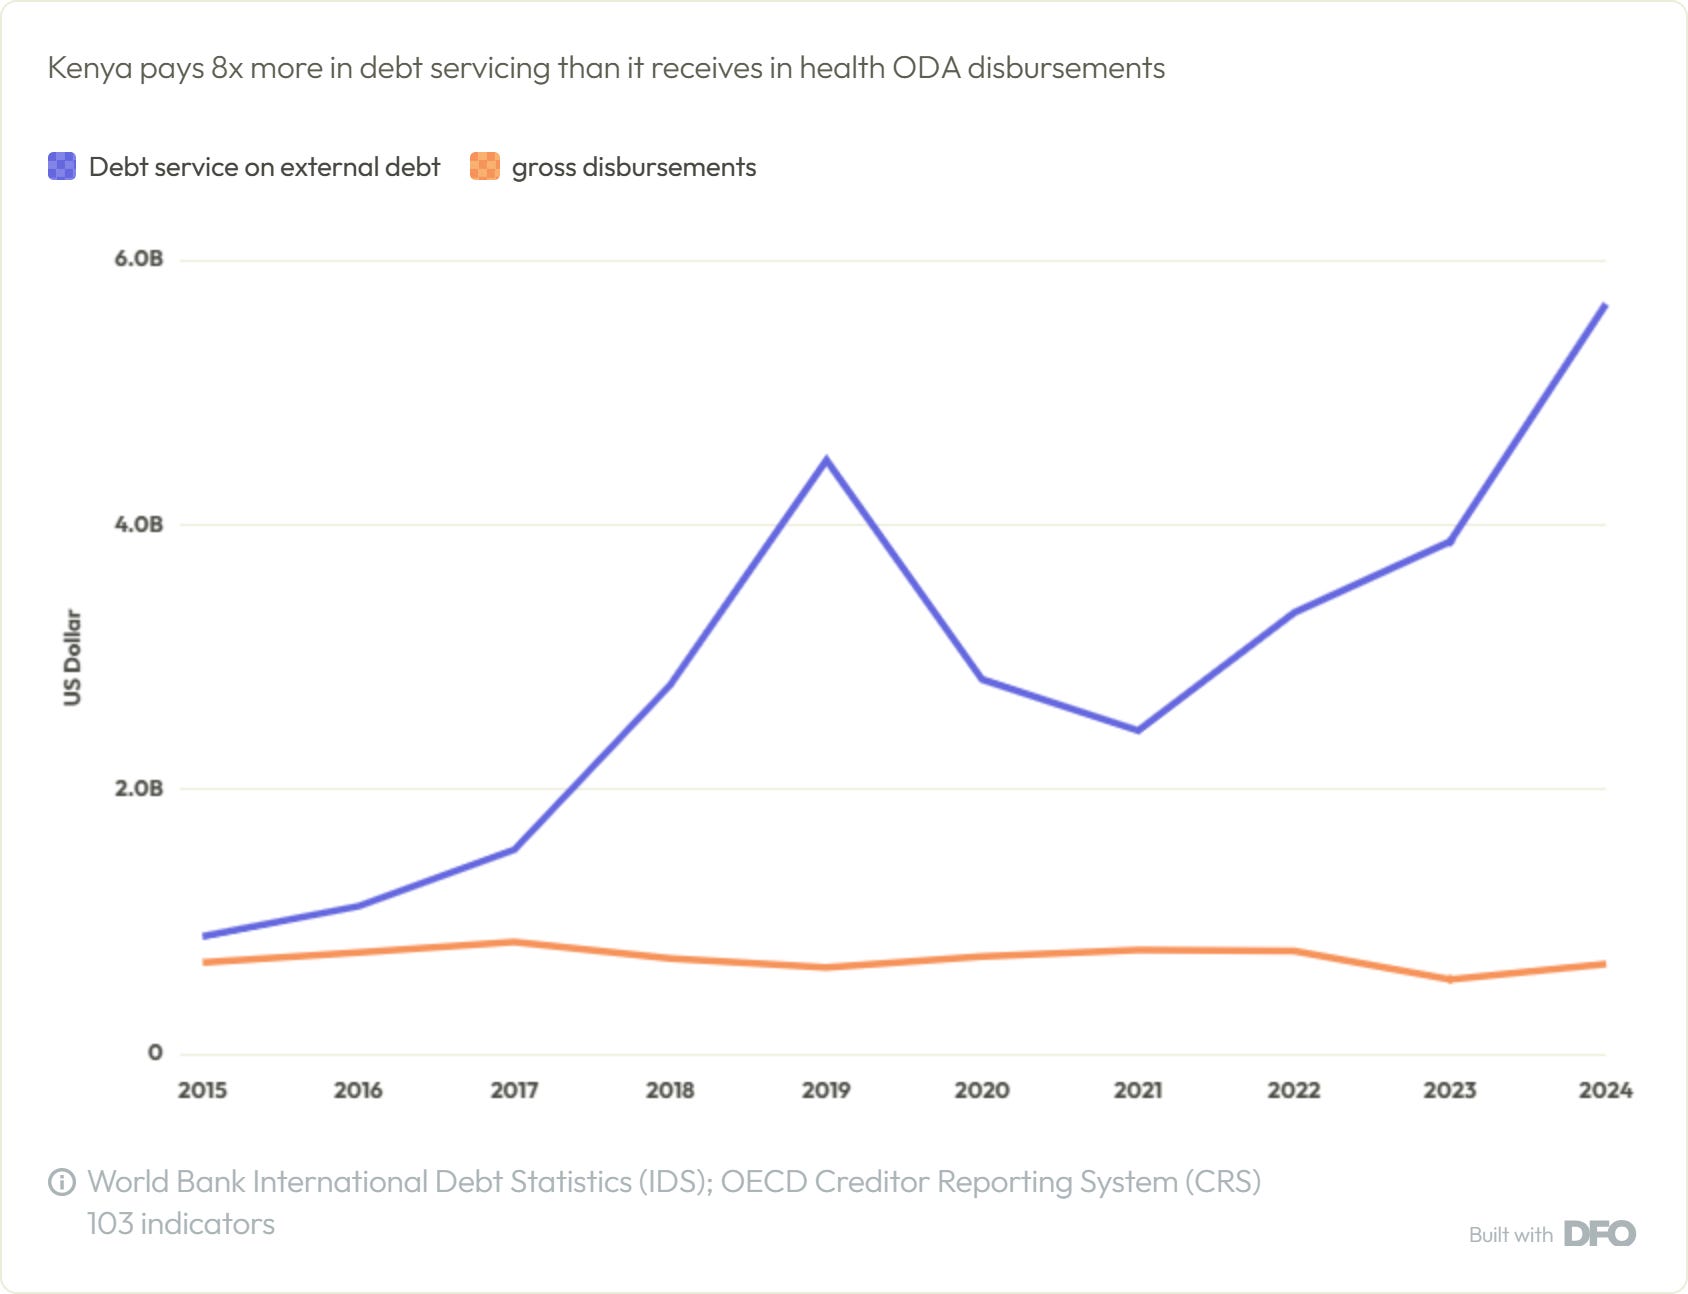
Try it yourself: "Compare Kenya's external debt service with its health aid, including HIV, since 2015."
See the spending behind a health success. Since 2000, Rwanda has cut under-five deaths by 80% and Ethiopia by 68%, two of the fastest declines anywhere. Both did it on modest health budgets: in 2023, total health spending was $177 per person in Rwanda and $85 in Ethiopia, counting government, donor and household spending together. Putting results next to spending doesn’t prove one caused the other, but it shows what progress looked like and what was spent along the way.
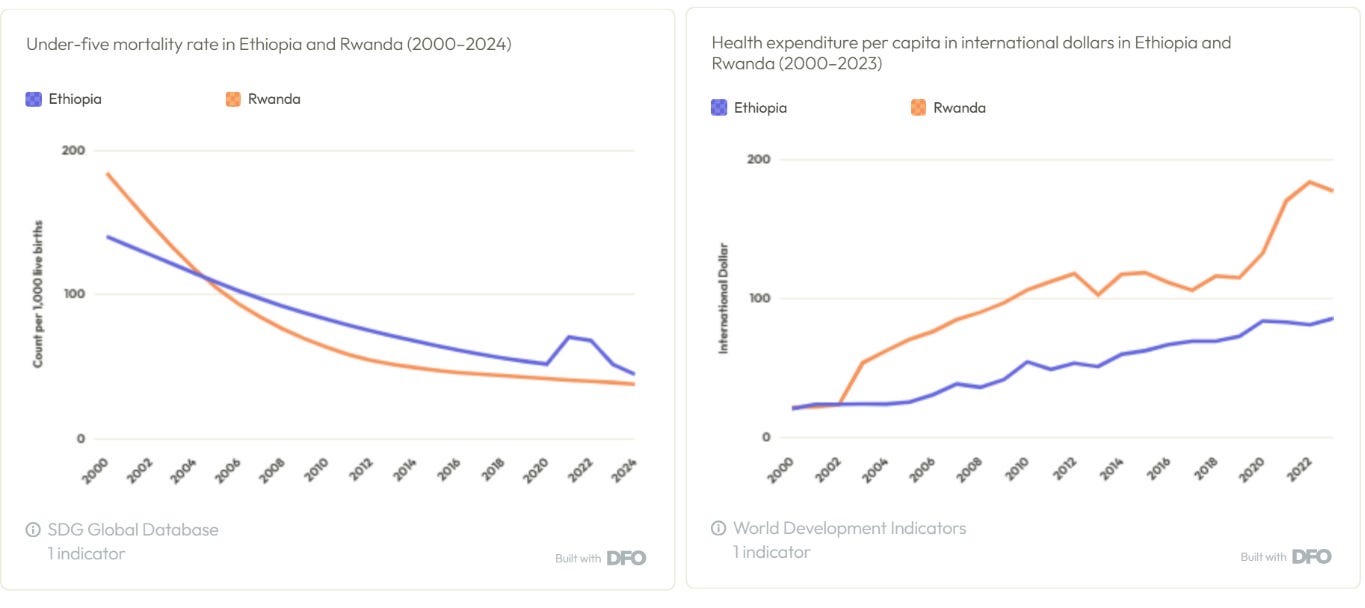
Try it yourself: "Show under-five mortality and health spending per person in Ethiopia and Rwanda since 2000."
See what currency a country’s debt is owed in. A country that borrows in dollars or euros has to repay in dollars or euros. When its own currency weakens, that debt gets more expensive without a single new loan. The risk is sharpest where currencies are unstable, as in Zimbabwe, which has replaced its currency several times. Seeing how a country’s debt is split by currency shows how exposed it is to the next shock.
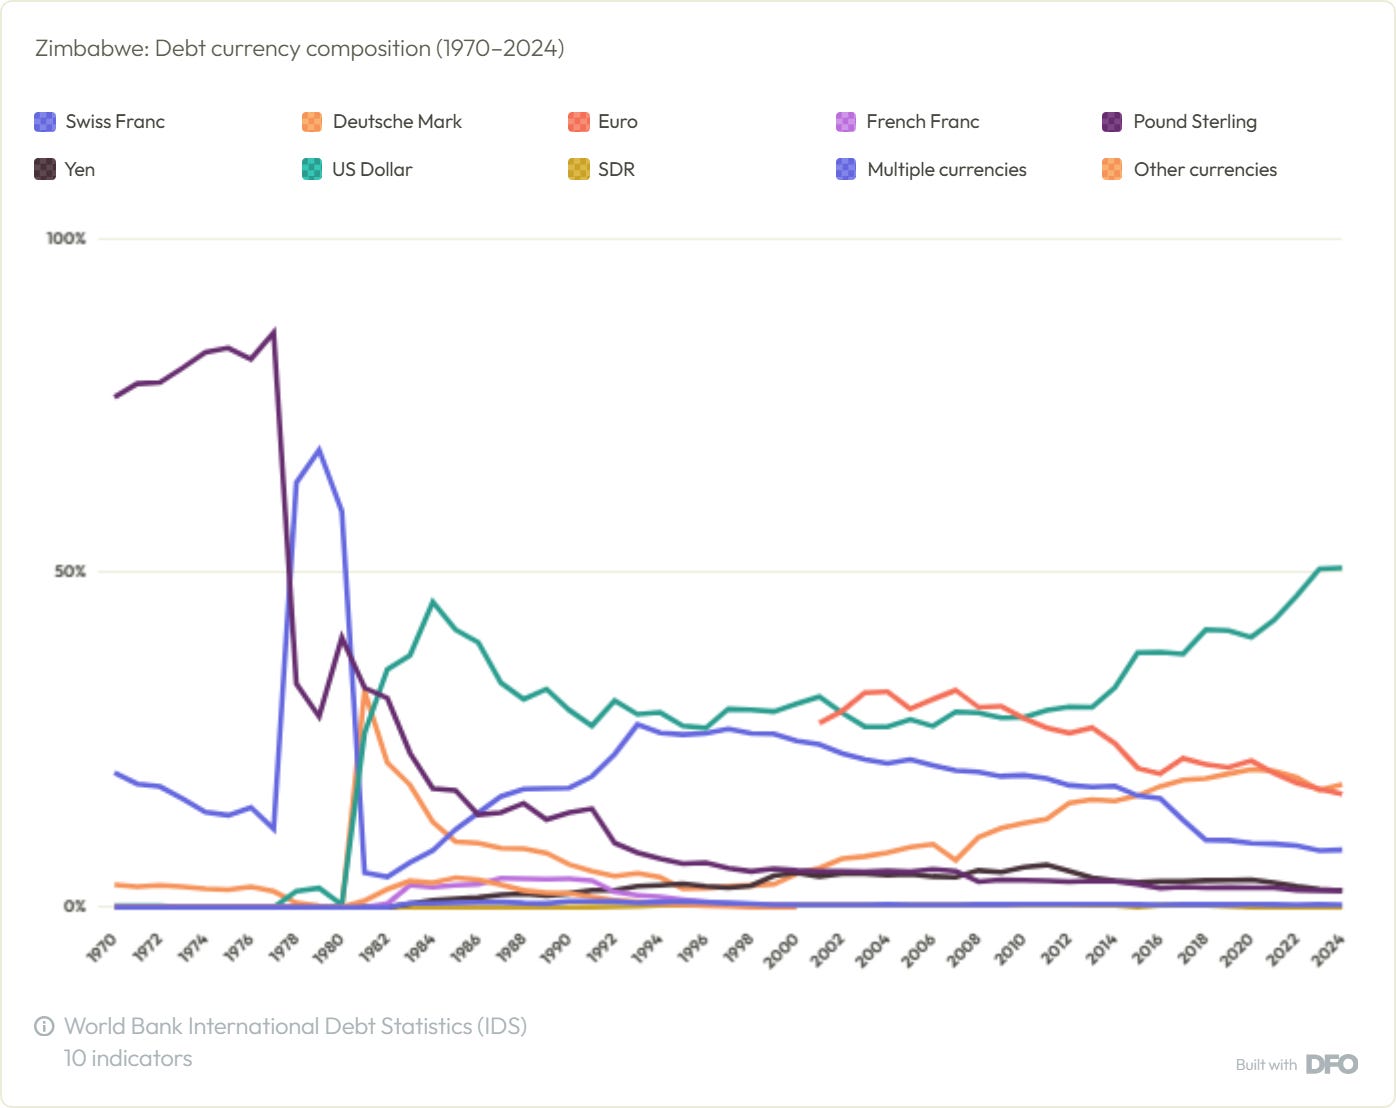
Try it yourself: "Show me Zimbabwe's debt composition held in different currencies"
Other pointers:
Where the numbers come from: official sources only. AI helps you ask and chart, but every figure links to the original file and a log of any changes the Observatory made.
How to cite: name the original source first, e.g. “OECD Creditor Reporting System (2026), via the Development Finance Observatory.” Share a snapshot link so the numbers don’t change after you publish.
What’s covered: each dataset runs to its publisher’s latest release.
FROM THE ONE TEAM:
David McNair explains what happened at the most important gathering of global finance chiefs.
IN THE QUEUE:
What the West can learn from AI optimists in the rest of the world.
ONE Data provides cutting edge data, tools, and analysis so that we can fight together for a more just world. See for yourself.